1) Polygon vertices
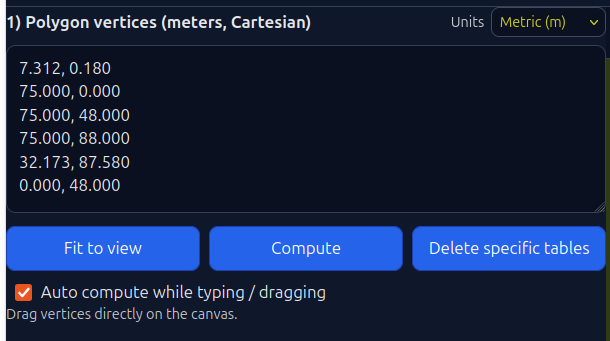
Edit or paste the polygon coordinates into the box. Coordinates should represent meters or feet thus belong to a Cartesian Coordinate Reference System (CRS).
Coordinates do not represent degrees at any case!
In the top-right angle choose the units to be used for the calculations.
After selecting units, enter all parameters below in the same unit.
Fit to view
The map zooms to fit the entire polygon on the screen.
Compute
Press this button to compute the panel layout when Auto compute is turned off.
Delete specific tables
Enables ‘delete tables’ mode. Click tables to delete them. Press the button again to exit.
Edit band layout
Enables custom modification of tables per band. The user can also shift an entire row toward the east. The maximum allowed shift distance is shown in the modal dialog that opens when the button is clicked:
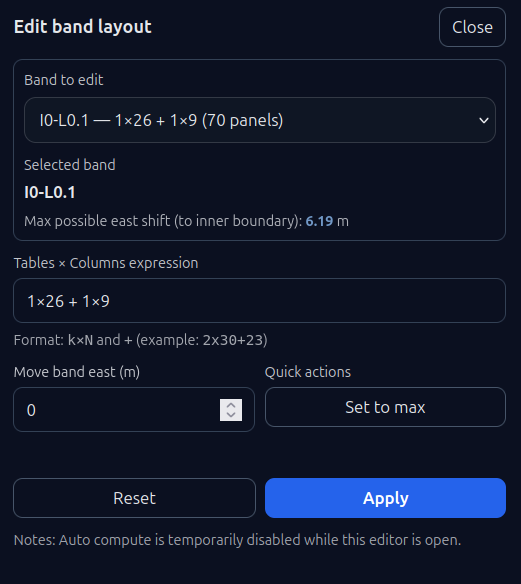
The user selects the band to be edited from the drop-down list. This list contains the names of bands or rows exactly as they appear in the “Results per row/band” table.
Note: A row is defined as the set of tables placed on the same horizontal line. If a row is split into multiple sections due to the polygon geometry, each section is referred to as a band, numbered from west to east.
Once the desired band is selected, the user can edit its table structure using the “Tables × columns expression” input field. By default, this field contains the automatically calculated table structure.
Here, the user can customize the table structure. For example, if a band consists of one table with 26 columns and one table with 9 columns (1x26+1x9), it can be edited to 1x35. After clicking the Apply button, the updated layout is immediately displayed on the canvas.
The user may also specify a shift distance toward the east if a horizontal shift is desired. By default, tables are placed at the westernmost possible position within the band.
The tables in the selected band are shifted once the Apply button is clicked.
The Set to max button shifts the tables to the easternmost possible position.
The Reset button reverts only the most recent edit applied.
2) Horizontal lines y = a + k·d
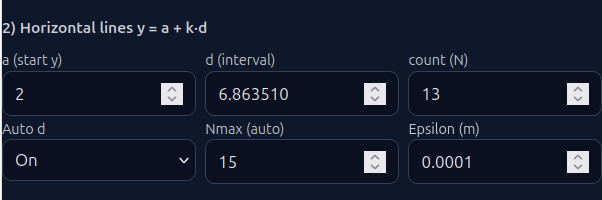
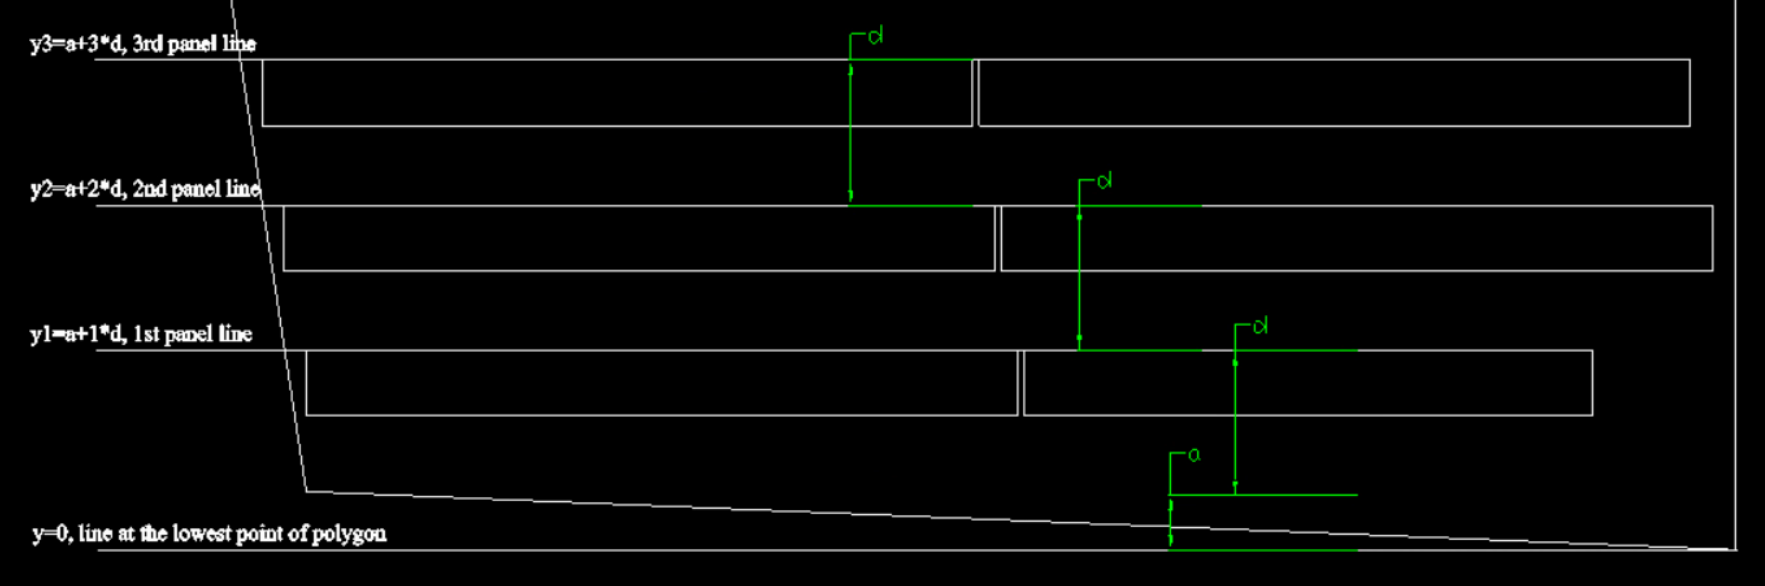
Horizontal lines indicate where the tables will be placed, as shown below:
a (start y)
Set a to define where table placement starts.
Counting starts from the southernmost point of the polygon. Default is a = 0.
d (interval)
Set the distance d between table rows (shown above), or let the app calculate it automatically.
count (N)
N is the maximum number of horizontal lines used to calculate table positions. If you want to cover the whole polygon area with panels, set N at Nmax–2 or Nmax-1. N is set automatically at Nmax-2, every time Nmax value changes.
If rotation angle is not equal to 0, you may need to set N value at N>Nmax, in order to cover the whole field with panels.
Tip: Another way to delete multiple tables (besides Delete Tables) is to reduce N, which removes whole rows starting from the north.
Auto (d)
Enable automatic calculation of the interval d (shown above). The interval is calculated from:
- Panel dimensions (height, width)
- Panel tilt angle (theta)
- Rows per table (Rows per table)
- Gap between panels rows
- Flat shade factor K
- Ground slope angle (phi)
Nmax
Auto calculated – Use it to set count (N) accordingly
epsilon
Geometric tolerance value. It is recommended to leave it unchanged.
3) Solar table parameters
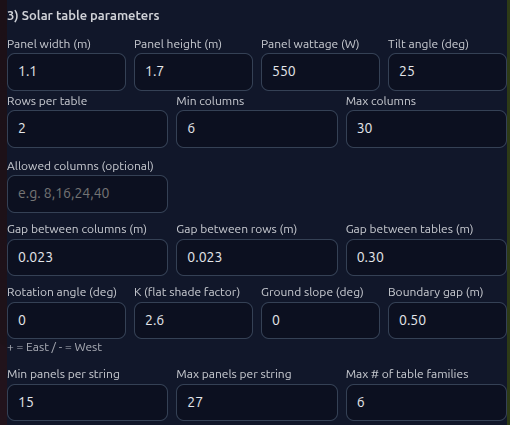
Panel width
The width of the panel used from the designer. It is defined in the manufacturer datasheet.
Panel height
The height of the panel used from the designer. It is defined in the manufacturer datasheet.
Tip: For landscape orientation, swap the values of Panel width and Panel height.
Panel wattage
The nominal wattage (Pmpp) of the panel used from the designer. It is defined in the manufacturer datasheet.
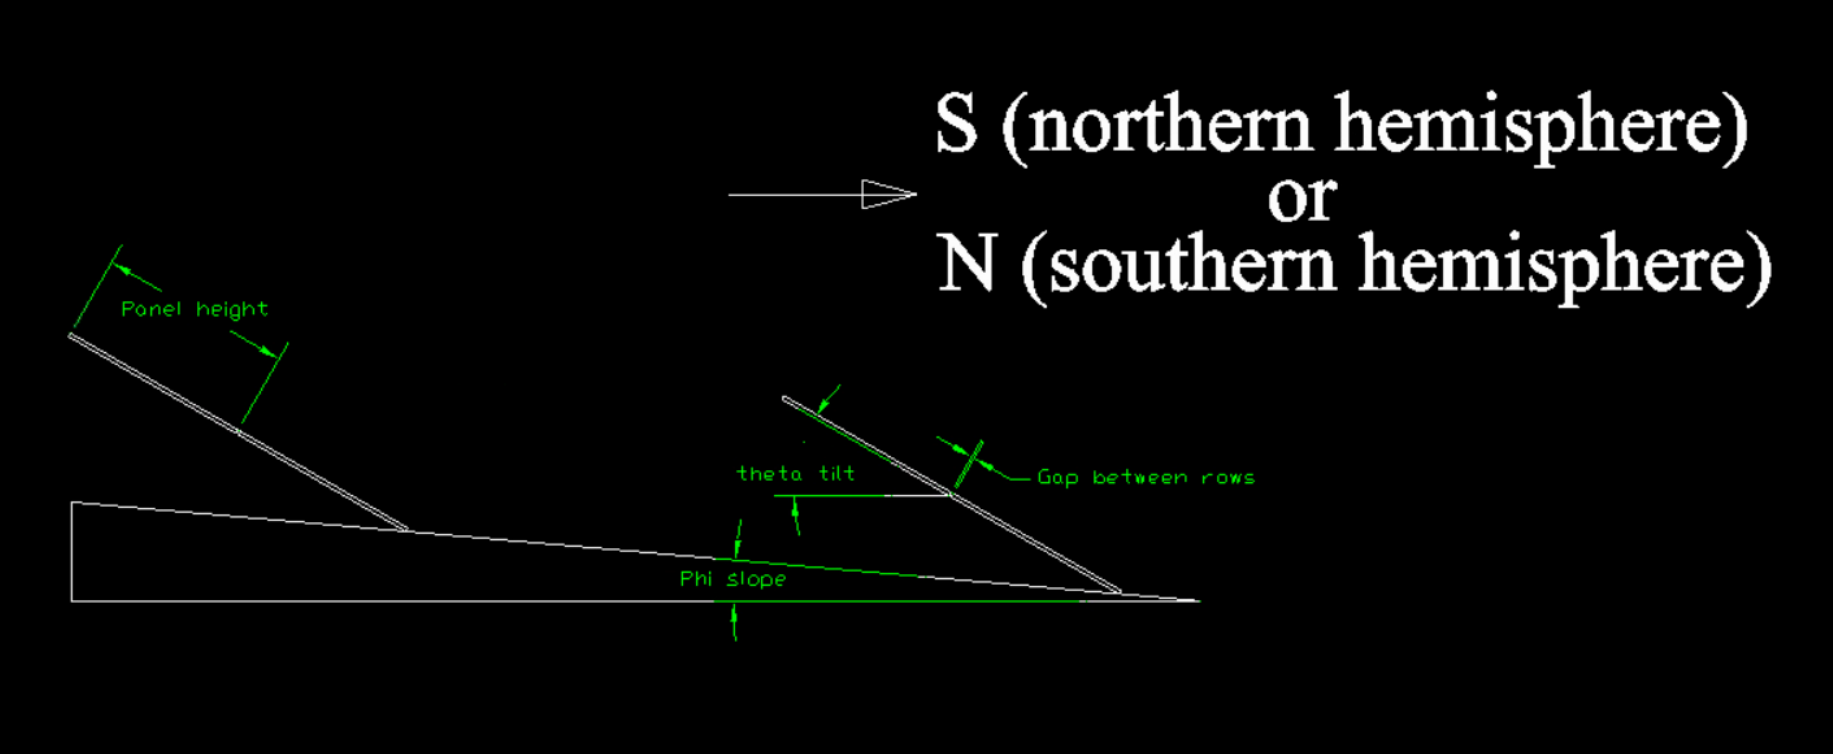
Side view of a typical solar installation showing the main input parameters. All angles are shown as positive values.
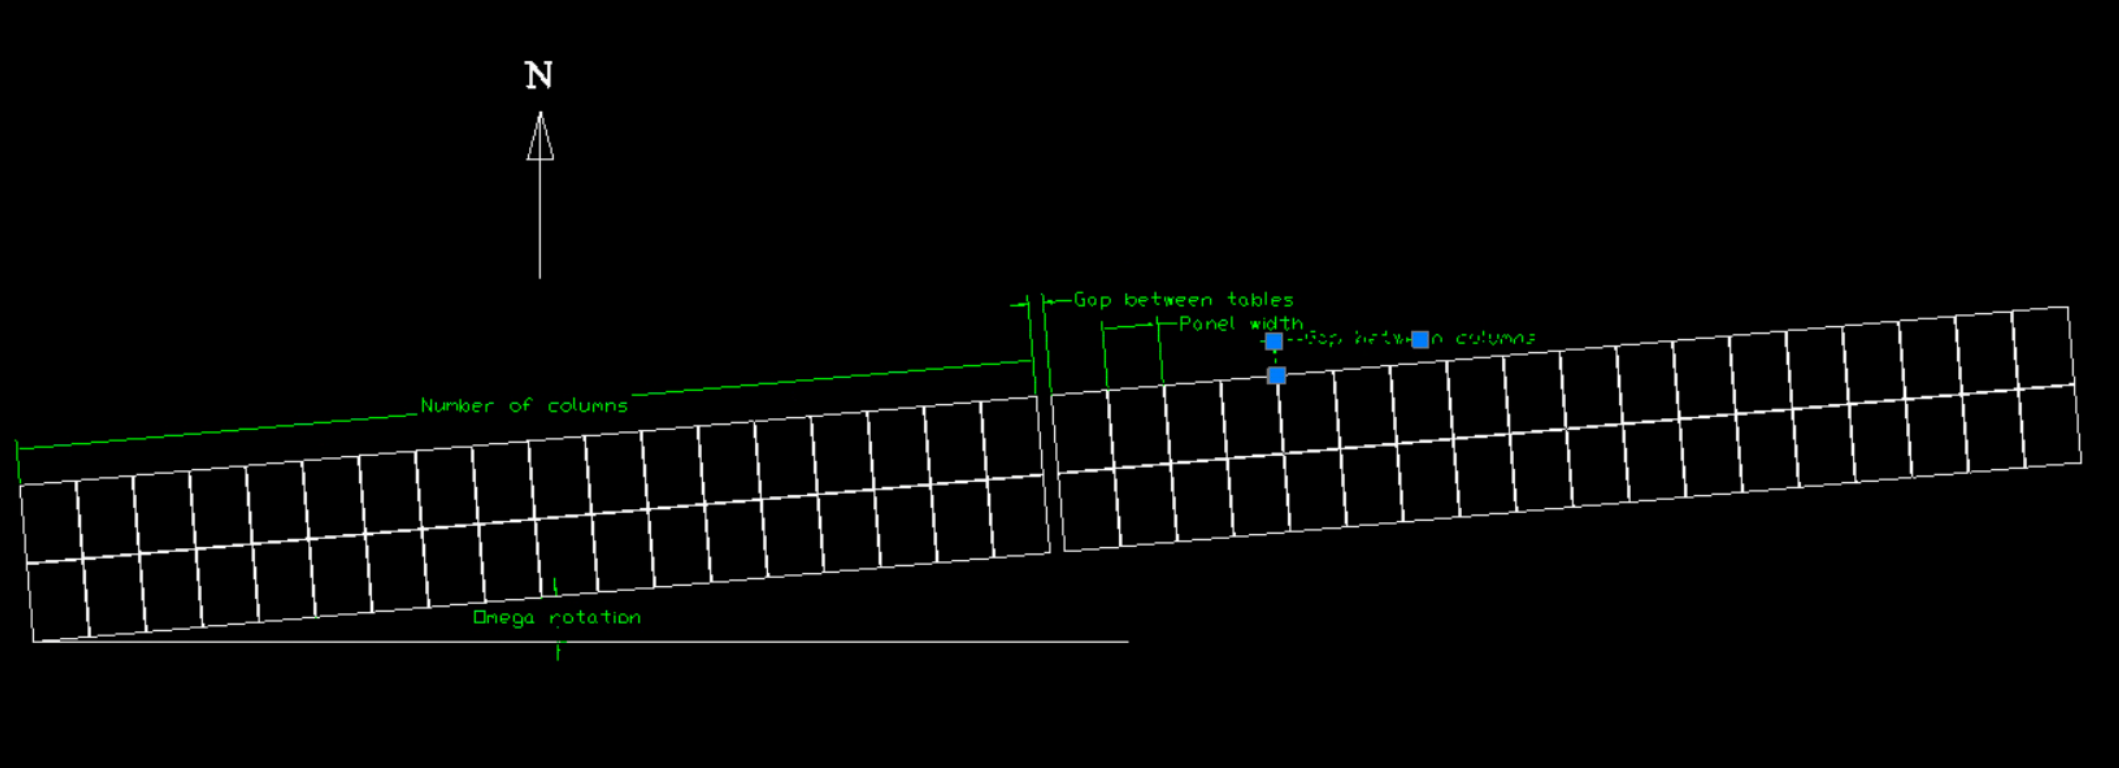
Top view of a typical solar installation showing the main input parameters. All angles are shown as positive values.
Tilt angle (theta)
Insert the design tilt (theta angle) of the panels (see the side view drawing above)
Rows per table
Enter the number of panel rows per table. In the top view drawing above “2” value should be entered.
Min Columns
Minimum number of panel columns that should be used in the layout calculation. The smallest tables will have (Min Columns × Rows per table) panels.
Max Columns
Maximum number of panel columns that should be used in the layout calculation. The biggest tables in the layout will have (Max Columns × Rows per table) panels.
Allowed Columns (optional)
Solar Planner calculates and optimizes the placement of tables when there is the restriction of specific columns per table. For example if only 12, 24, and 36 column tables can be placed, then the user enters comma seperated values "12, 24, 36".
If a value is entered then min/max columns are ignored. Delete the values to switch back to min/max columns layout calculation
Gap between columns
Enter the gap distance between panel columns in a table (see the top view drawing above)
Gap between rows
Enter the gap distance between panel rows in a table (see the side view drawing above)
Gap between tables
Enter the gap distance between tables placed on the same horizontal line (see the top view drawing above)
Rotation angle (omega)
The rotation angle of the tables (see the top view drawing above). Positive values mean rotation towards E – just like the top view drawing depicts. Negative values mean rotation towards West.
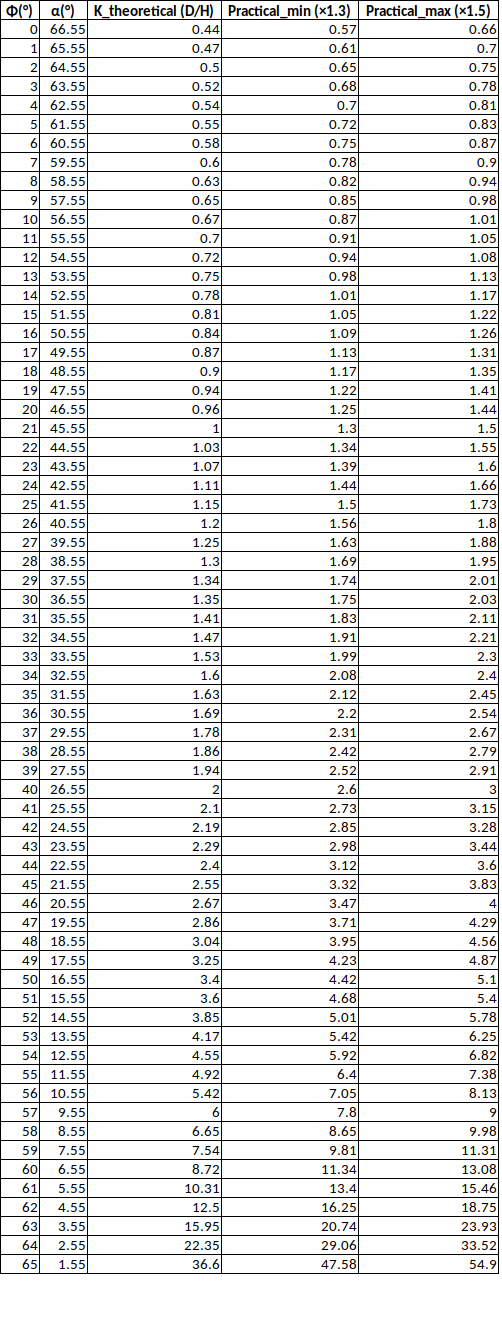
K (flat shade factor)
Typically, K = b · cot(α), where α is the design sun elevation and b is a factor between 1.3 and 1.5.
Below is a table showing typical values for various latitudes (absolute values):
Ground slope (phi)
The ground slope. Positive values indicate a slope that drops toward the south in the Northern Hemisphere, or toward the north in the Southern Hemisphere (see the side view above).
Tip: Adjust for the rotation angle omega, and insert the ground slope towards the direction of that rotation angle
Boundary gap
Clearance to border. Insert the minimum Euclidean distance from any table edge to the field boundary
Min panels per string
Minimum number of modules allowed in one string. Set this based on both the inverter and the module electrical characteristics.
Solar Planner uses this value to suggest a string grouping per band (row group), minimizing leftover modules and helping reduce DC cable complexity.
Max panels per string
Maximum number of modules allowed in one string. Set this based on both the inverter and the module electrical characteristics..
Solar Planner uses this value to keep string groupings within limits while reducing leftover modules per band.
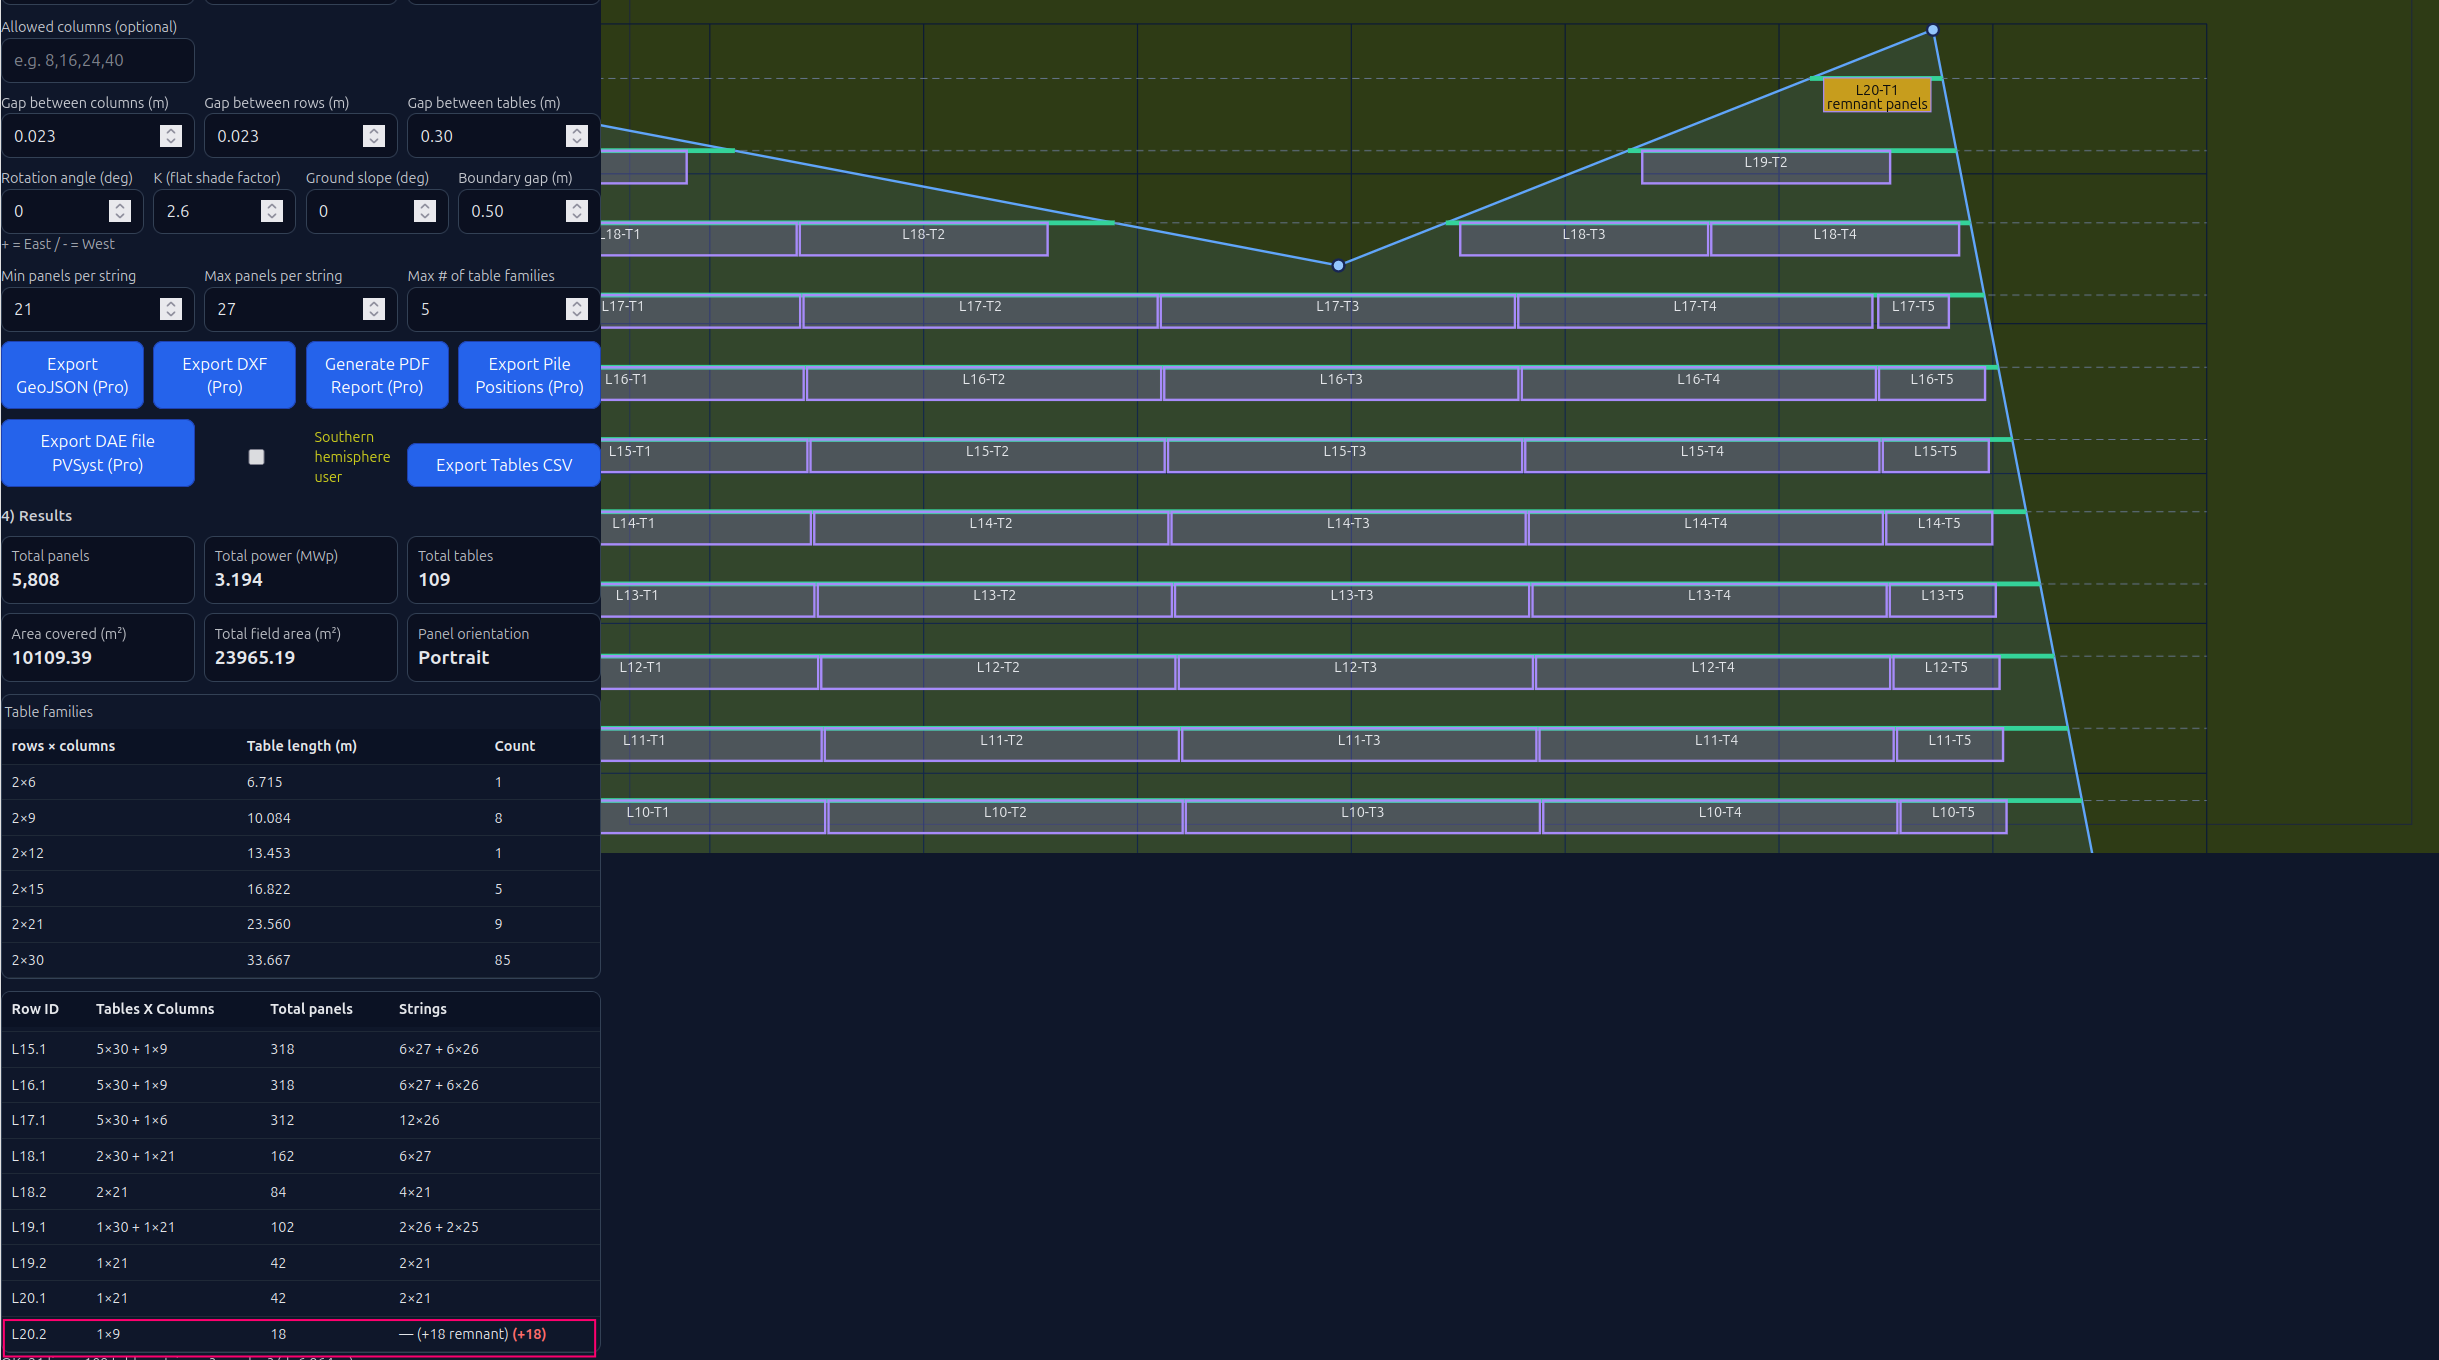
Sometimes in a band of tables no combination of panels per string results in integer number of strings. If this is the case, then the remnant panels should connect with panels of an other band. The table that has the remnant panels is annotated with orange color and the corresponding text.
That way the electrical layout designer is notified about where and which modifications that should be done in the string layout
Max number of table families
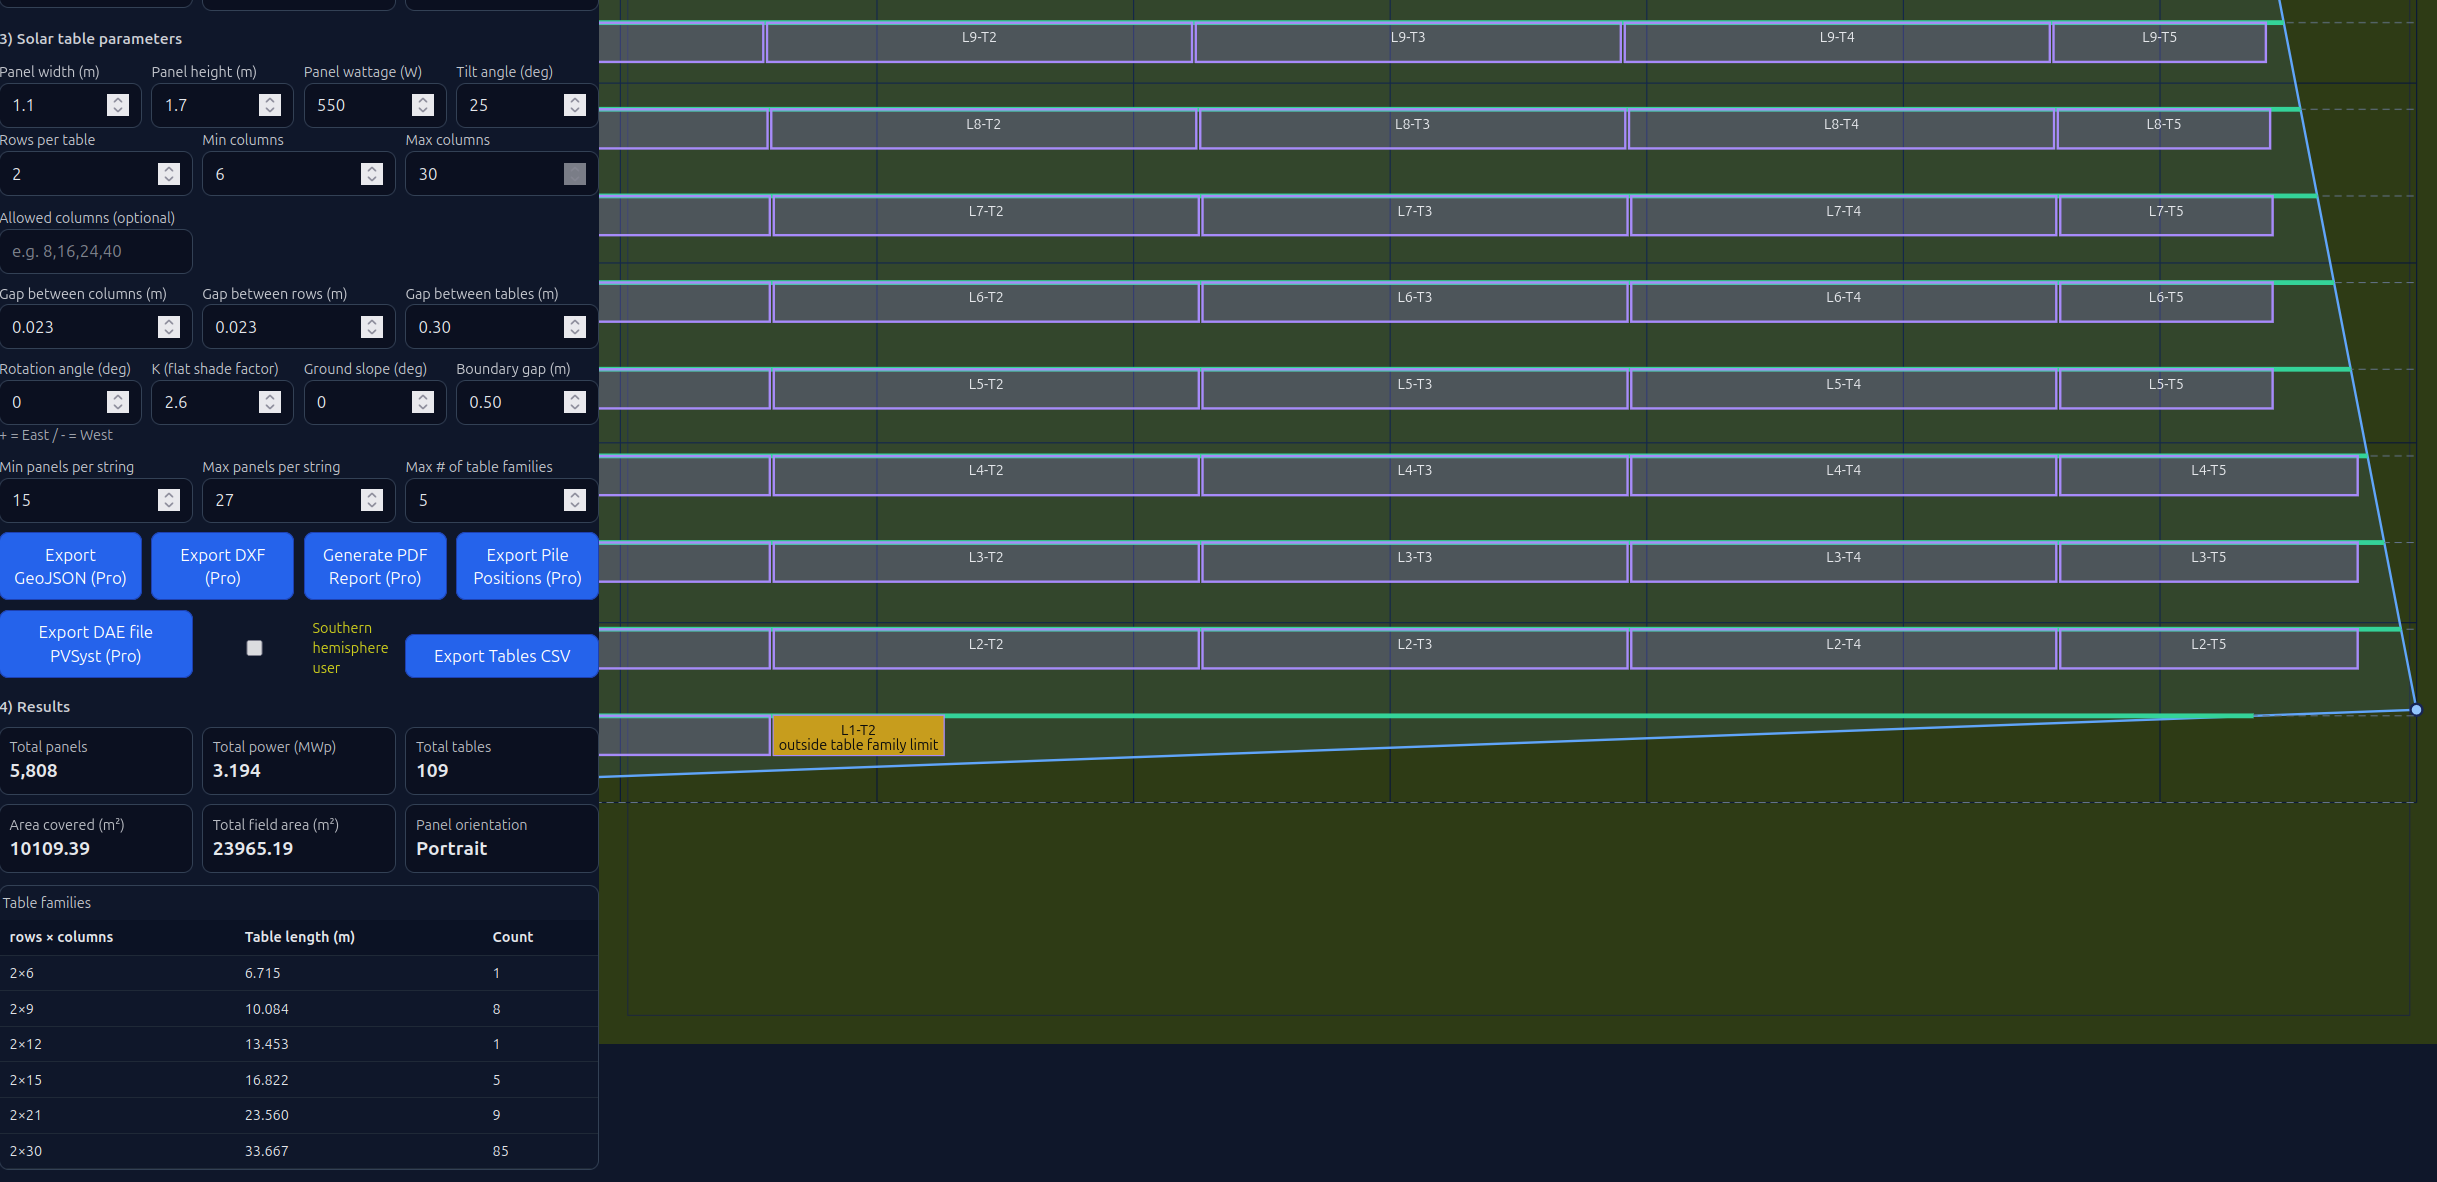
Tables with the same number of columns are considered the same “family”. Set a maximum number of families to limit the variety of table lengths on site.
Solar Planner will try to respect this limit while still prioritizing the maximum total number of modules that fit in the field.
In some geometries, a few extra families may be unavoidable. Those tables are highlighted in orange with a note in the canvas.
Placing Single Axis Trackers
To approximate single-axis trackers (tracking east–west), set:
Omega=90
Theta tilt = 0
d=a user defined specific interval distance (d) - toggle off the Auto-d option
4) Export Buttons
Export Tables CSV (free)
Exports the coordinates of the four corners of each table, along with basic properties such as panel count and columns/rows.
Export GeoJSON (Pro)
Ideal for solar project developers. It can be used in GIS software and presentations that overlay the panel layout over a satellite or other map.
Export DXF (Pro)
Exports the layout in 3 layers:
- Field Border
- PV Panels
- PV Tables
Ideal for solar engineers designing in a CAD environment.
Generate PDF Report (Pro)
Exports a professional report of the designed layout, ready to send to mounting-system manufacturers as a request for offer (RFO). A dialog box appears where all data of the installation are inserted, and then the report is generated.
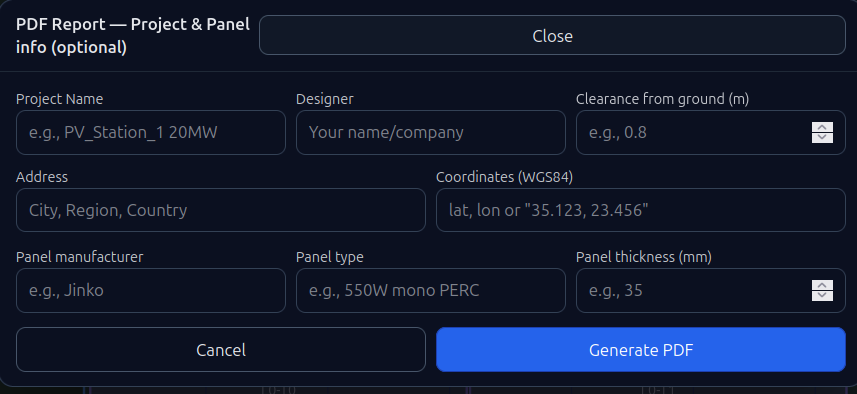
Tip: Press "Fit to View" button before "Generate PDF Report" to fit the layout in the pdf page.
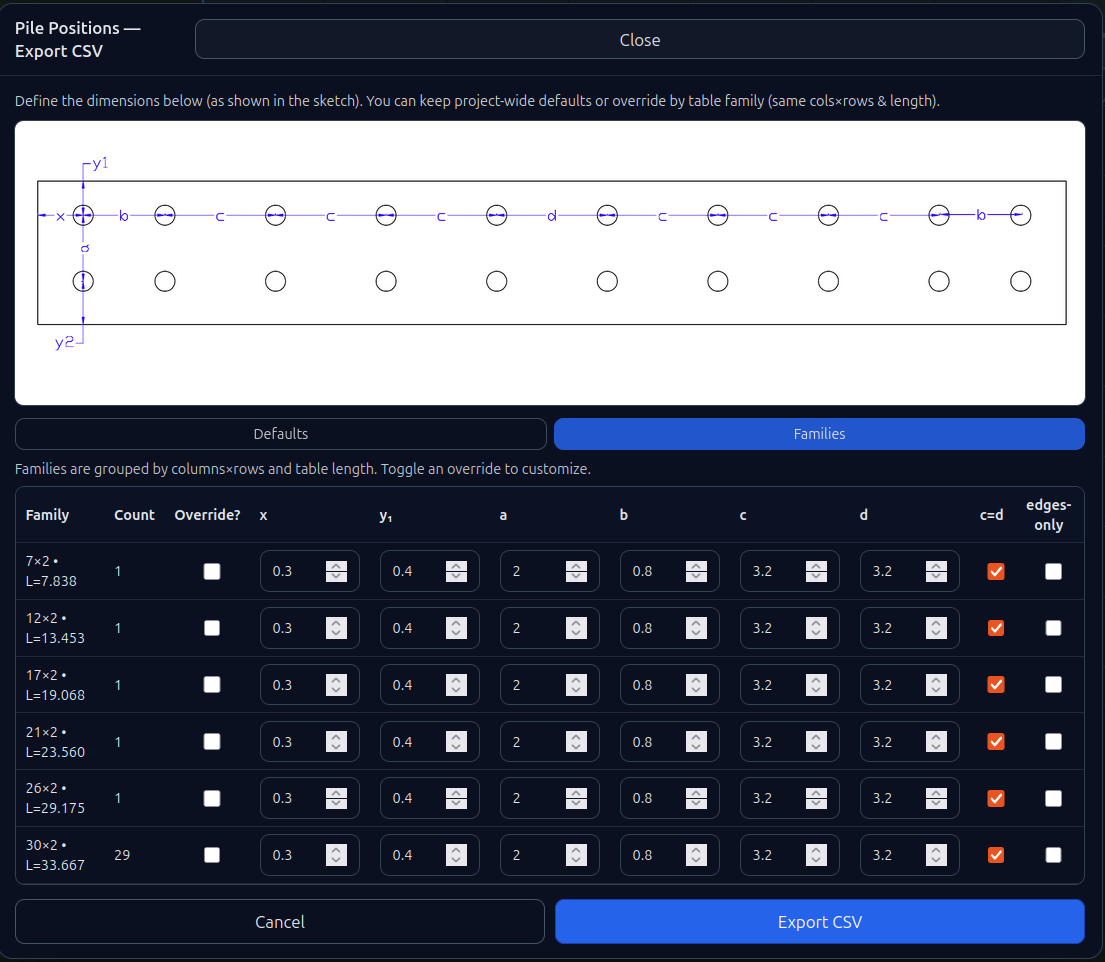
Export Pile Positions (Pro)
Exports the positions of all piles in the installation in CSV format. A useful tool for survey teams during construction.
A dialog box appears where pile position parameters are inserted:
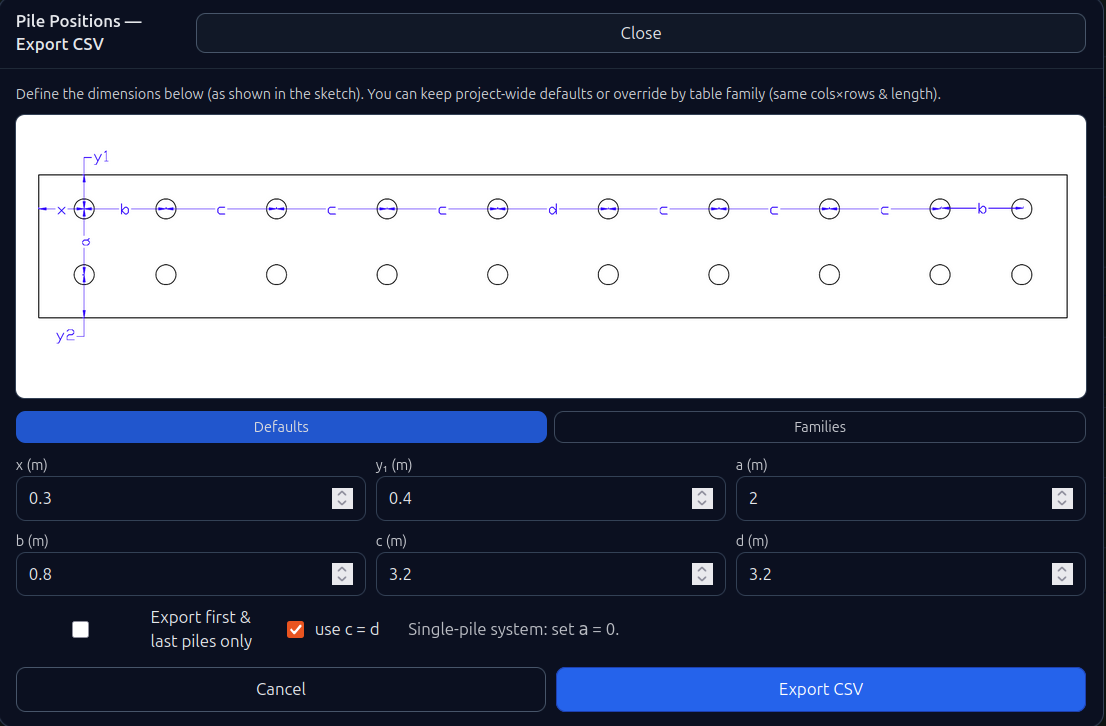
The user defines the relative position of the piles with the top right angle of the table as reference point.
Parameters x,y1 define the position of the first pile.
Then the horizontal (b, c, d) distances between piles have to be defined
If pile positions differ between table lengths, use the ‘Families’ tab to enter (x, y1, b, c, d) for each table type.
The exported CSV file is in the form of:
pile_name,x,y
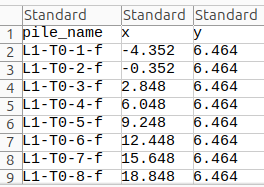
Pile_name format is: TableID_PileNumber_b or TableID_PileNumber_f, where:
TableID comes from the results table on the main page (bottom-left).
PileNumber counts from left to right (west to east).
b / f indicates whether the pile is in the back or front row.
x, y are the pile coordinates.
Export DAE file PVSyst (Pro)
Exports the 3D model of the installation. It can be inserted in the PVSyst scene and be used as a base for further calculations in this software.
Save project
The Save/Load Project buttons are located on the left side of the top bar.
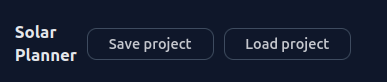
Click at the “Save project” button in order to save the current project locally on your pc.
Load project
Click to load a project you have saved. If you load a previously exported project, exporting the same layout again will not charge tokens.
5) Results
Summary results and table
When placing panels, Solar Planner optimizes for:
- Maximum total number of panels
- Minimum number of table families
- Minimum number of tables
- Minimum number of panel strings per row/band (especially when a row is split by the polygon geometry)
This helps you reach a more cost-effective layout.
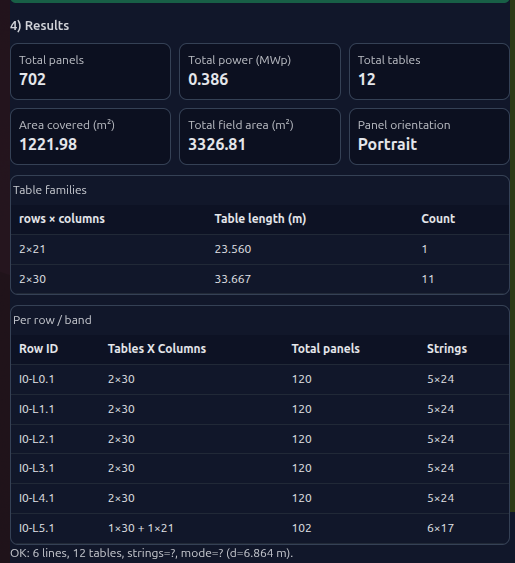
In the Results section, you can quickly review:
- Total panels placed
- Total nominal power of the PV station
- Total tables placed
- Area covered by the panels
- Total field area
- Panel orientation (landscape or portrait, based on the Panel width / Panel height values)
A summary of the table families used in the layout is also provided as a list. For each family, you can inspect rows, columns, table length, and the total number of tables placed.
Results per row/band
A detailed per row/band table at the bottom of the Results section shows:
- The row/band ID in the form IX-LY.Z, where:
IX indicates the “island” index, counting X from top to bottom when the polygon is split into island polygons due to field geometry
LY indicates the horizontal line index, counting Y from bottom to top
.Z indicates the band index, counting from left to right when a horizontal line is split into multiple bands due to field geometry
- The table structure within each row/band.
For example, 3x30+15+6 means that in that row/band there are 3 tables of 30 columns each, 1 table of 15 columns, and 1 table of 6 columns.
- The total number of panels in each row/band
- The calculated string structure for the panels.
For example, 6x17+5x16 means that the panels in that row can be connected into 6 strings of 17 panels each and 5 strings of 16 panels each. In rare cases—when a row/band is too short—some panels must be connected to a neighboring row to form complete strings. In that case, the remaining panels are shown in red. For example, 6x17+5x16+4 (with +4 in red) means there are 4 panels that must be connected to the next or previous row to complete a string. This significantly helps the electrical layout designer.